QQQ 30-minute chart below. All chart markings the same as the one from Oct 11. Obviously, the double top target is now tagged.
What to expect next? This we have to use STOPD to tell us whether the process is completed.
The start of this selloff was a rejection of 3rd quarter high. It swiftly dropped to right below 3rd quarter low (the higher red line) and bounced.
Then 2nd quarter high acted as resistance and sent QQQ down to the 3 pushes up target. But 2nd quarter high resistance implies 2nd quarter low (153-154) and potentially year low (150) being the targets.
So the price to watch out for is whether 3rd quarter low up to January high acting as resistance or not.
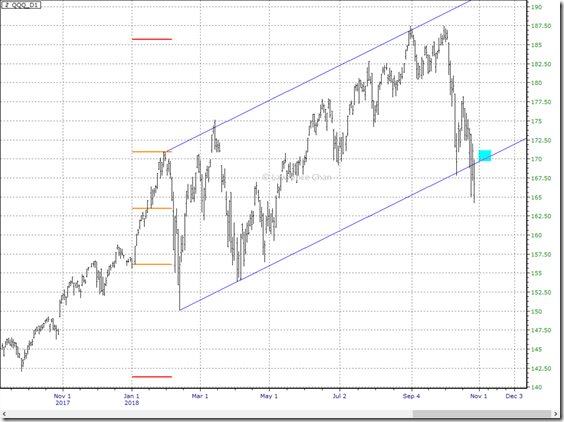
Interestingly, that lines up with the up channel bottom on daily that was just breached this week. See the chart below.
The orange lines highlight the January range. January being the open range for the year has already given us the top of the year so far by its 100% expansion to the upside. Failing to close above the resistance zone mentioned earlier (the cyan box) means we are likely going to see a drop to January low, year low so far and possibly expansion down to 140-142 area.


